Characteristic |
Beta |
95% CI 1 |
|---|---|---|
| age | -0.04 | -0.05, -0.04 |
| 1
CI = Credible Interval |
||
Ages
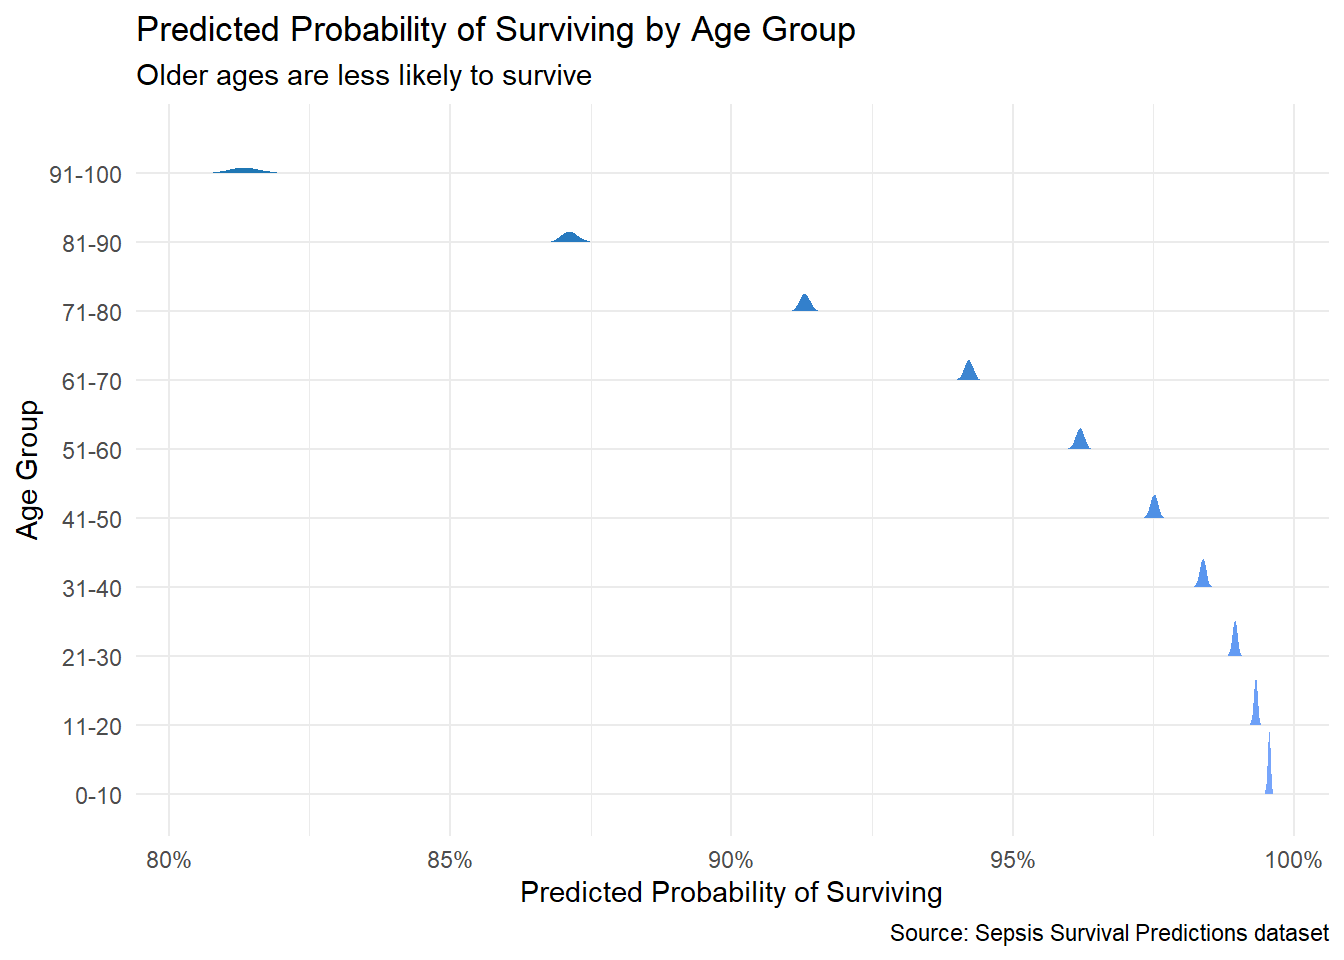
To see the effect of age, I use the following equation…
\[\text{logit}(\pi_i) = \beta_0 + \beta_1 \cdot \text{age}_i \]
From this we see that for every additional year of age, survival rate decreases.
The model, once graphed mimics a parabolic curve.
